Data Visualization
Insights through Visualization
Insights through Visualization
Apart from a wide range of reporting dashboards and statistical graphs,
we have a creative visualization expertise across multiple domains that would lead to
deeper understanding of a given problem leading to deeper insights.
Following is a set of sample visualizations we have coded ourselves to get deeper insights into the domain.
These are few screenshots from our custom animated visualizations.
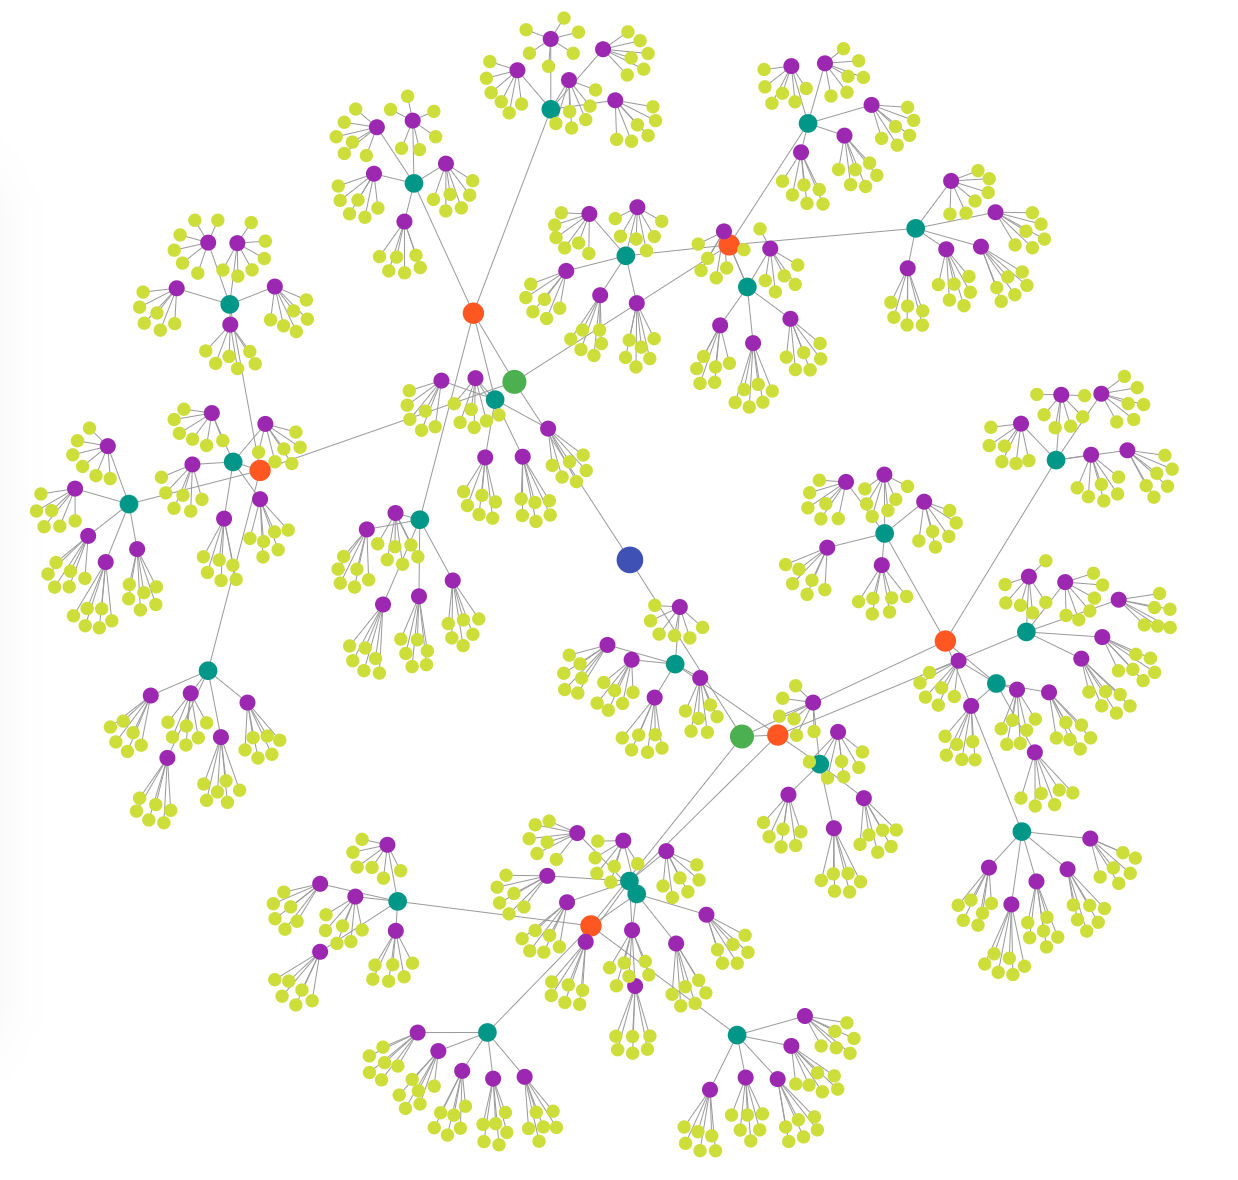
Pandemic Study (Research/COVID19)
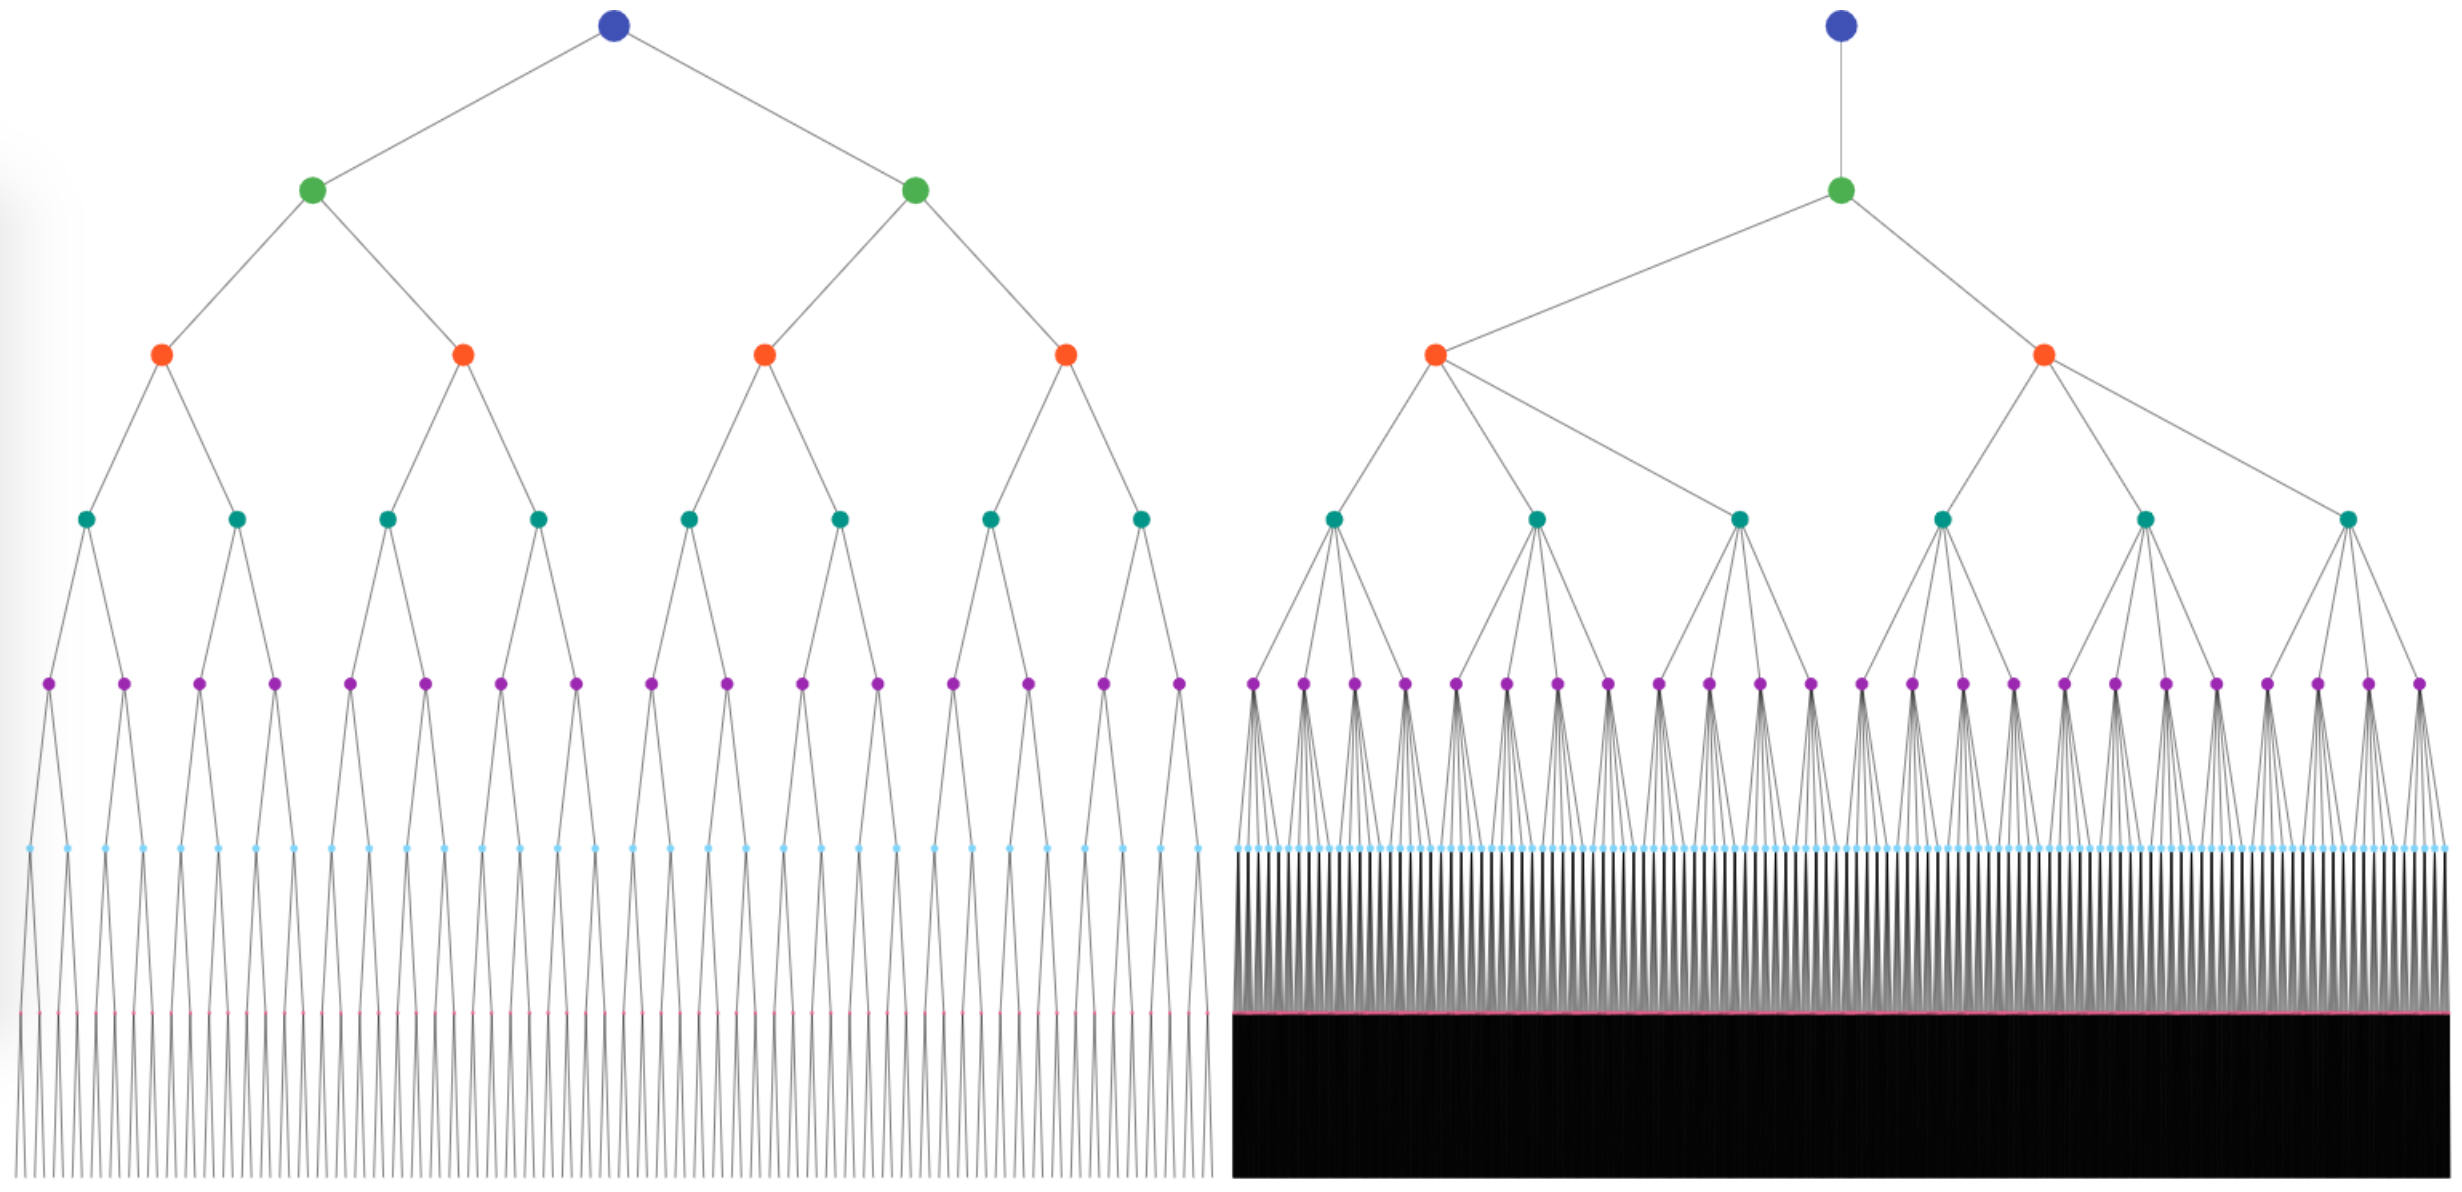
Exponential Insights (Computer Science)
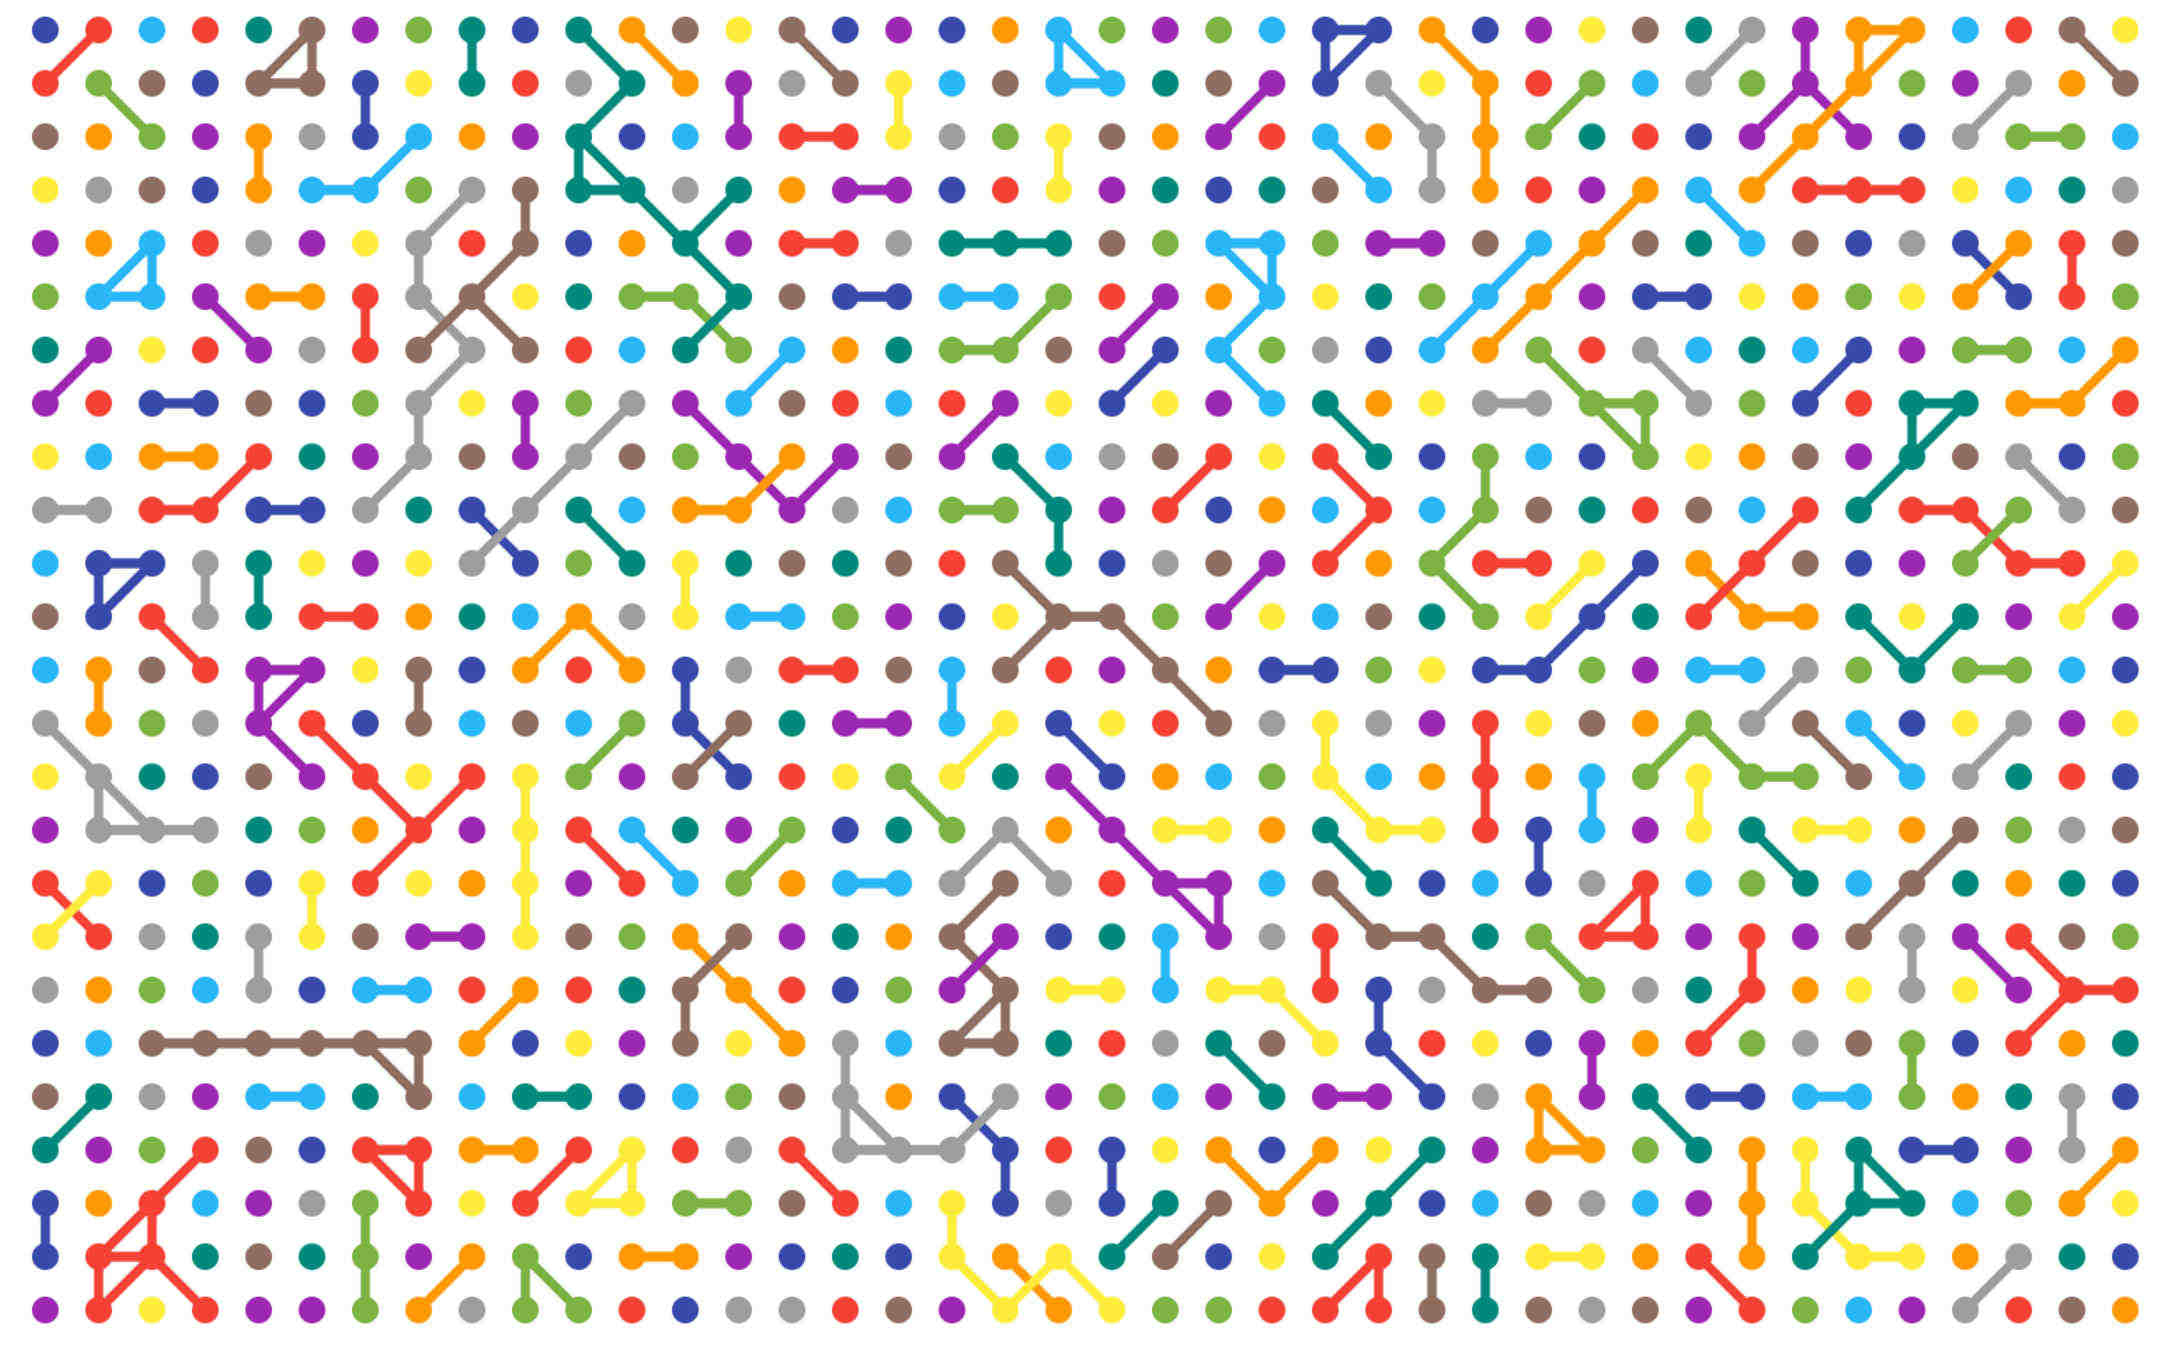
PI (Mathematics/Asthetics)

PI (Math/Research)